Systems Solutions Engineering
CFD is Computational Fluid Dynamics that is similar to FEA (finite element analysis) on solid parts, but is done with solids, liquids, gases, AND heat transfer. CFD looks at the flows within these mediums. Yes, heat transfer studies are capable with CFD.
Over the past few years, many engineers have gotten comfortable and rely upon FEA and dynamic simulation analysis. Many engineers have heard about CFD, but not many know about the capabilities of CFD analysis. When compared to FEA analysis, CFD is much more complex. In FEA analysis, the loads often follow a straight line path and inputs to the model tend to focus only on material strength and modulus of elasticity, which takes much less computing power. In CFD analysis, the flow can go in a multitude of directions that are based on a path of least resistance, and things like fluid viscosity, turbulent / non-turbulent flow, surface roughness and cooling of interfacing components which affect the flow direction and volume. All of these inputs require much more computing power than FEA analysis. With the increase in computing power and understanding of how best to do numerical analysis in various CFD software programs, CFD analysis is now becoming much more mainstream and available to a variety of industries.
Let’s take a look at a typical flow study.
In the graph below, we now are looking at velocity vectors. These vectors indicate the direction of the velocity. It helps us to see how the flow is moving through the SSE logo. As we go through design iterations in a design study, these vectors help us to determine where to add or remove structure to modify the flow direction and ultimately the velocity.

Next we focus on pressure. Using the lower scale for pressure, we can see that the highest pressure is immediately following the inlet to the SSE logo. The pressure decays as the flow moves from left to right through the SSE logo and the pressure is at its lowest nearest the outlet.

Now, looking at the pressure along with velocity vectors, we can see how the pressure drives the velocity vectors. As we modulate the colors in the scales, we can see these influences in higher detail in the second, zoomed, picture below where we are focusing on the pressure detail in the second “S”.


So, what is CFD?


Please click on a button below to see some of our special tech skills
Consider the Systems Solutions Engineering logo above. Assume that this would be a solid body. If you look, you will see a small hole on the left sidewall, just below center. Let’s apply a hydraulic oil flow at 3000 psi (200 barr) to this area. On the right side wall, just above center, you see another hole. At this hole, we will let the flow dump to normal atmospheric conditions, or, in other words, this would be a pressure of 0 psi gage. We’ll also assume that we covered the logo with a super high strength glass that holds the oil flow in the SSE cavity. Since we have a high pressure on the left side and low pressure on the right side, the flow will move from left to right.
Now, we will apply the Systems Solutions Engineering flow tool and see what happens.
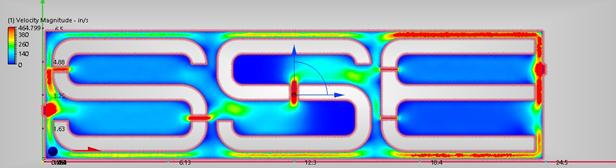
First, we see that the velocity profiles of the hydraulic fluid on a given plane in approximately the middle of the SSE logo below. Low flow velocity areas are in the dark blue and high flow velocity areas are in the dark red. As one would surmise, in the center “S”, the “dead end” areas have low flow velocity. The inner areas of the “E” have somewhat higher flow velocities due to the small inlets on the vertical part of the “E”, however the highest flow velocity is around the “E” due to slightly wider areas with less resistance allowing higher flow velocity. (Metric conversion 25.4mm = 1 in.)
Now, we will apply the Systems Solutions Engineering flow tool and see what happens.
First, we see that the velocity profiles of the hydraulic fluid on a given plane in approximately the middle of the SSE logo below. Low flow velocity areas are in the dark blue and high flow velocity areas are in the dark red. As one would surmise, in the center “S”, the “dead end” areas have low flow velocity. The inner areas of the “E” have somewhat higher flow velocities due to the small inlets on the vertical part of the “E”, however the highest flow velocity is around the “E” due to slightly wider areas with less resistance allowing higher flow velocity. (Metric conversion 25.4mm = 1 in.)
With the Systems Solutions Engineering CFD tools we can do a variety of different tasks that are similar to the above demonstrations. We can do heat transfer studies, look at changes in density and viscosities as flows move through phase changes or pressures.
A variety of industries can use CFD analysis. Some typical analysis areas include the following:
• - Industrial plants - heat exchanger sizing and design, thermal processing system designs.
• - Architectural design - HVAC airflow through rooms, HVAC sizing, structural load resistance to high winds,
piping system designs. Occupant comfort studies of airflow velocity and heating / cooling in rooms and
buildings based on ASHRAE ( American Society of Heating Refrigeration Air Conditioning Engineers)
Standard 55-2004.
• - Electronics / electrical design - circuit board thermal analysis, electronic components design for proper
heat transfer.
• - Vehicles - cooling system design, hydraulic system design, heat exchanger design, HVAC system design,
external body aerodynamics, underhood airflows.
• - Engine intake and exhaust airflow, engine cooling system design.
• - Pumps - internal flow design, flow parameterization for motor sizing
Heat Exchangers and Radiators - heat exchanger sizing and design, design for cooling flow medium
and flow availability.
• - HVAC Systems - heat exchanger sizing, flow requirements, burner sizing and design
Heat shielding - design of heat shields, design of heat shield materials.
• - Consumer Products - heating / cooling element design, flow design, heat transfer studies.
CFD can do convective, conductive and radiant heat transfer studies, as well and turbulent / non-turbulent flows, compressive / incompressible flows, multi-flows, and phase change studies.
Another way that we can look at flow results is to use traces. This is very similar to the videos of the car wind tunnel testing, where we see the car in the wind tunnel with the smoke traces going over the body of the car in the airflow. Traces basically take the velocity vectors and string them together to show the flow through the body. This makes it very easy to see how a fluid particle moves through the object, as shown below. Changes in color of the flow traces show localized velocities of the fluid particles. Additionally, more traces flowing into an area of an object generally correspond to higher flow in the object.
Powered by Cully Productions Content Copyright 2015 All rights reserved.
cullypro@gmail.com SYSTSOLNS.COM
cullypro@gmail.com SYSTSOLNS.COM